The website uses cookies to deliver services in accordance with the Cookies Policy. You can define the conditions for storing or accessing the cookie mechanism in your browser.
-
About us
-
Vendors
-
IT solutions
-
Automation & Management
- Professional Services Automation
- BAS | Breach and Attack Simulation
- CEM | Critical Event Management
- RMM | Remote Monitoring and Management & helpdesk
- SIEM | Security Information and Event Management
- SOAR | Security Orchestration, Automation and Response
- UEM/MDM | Unified Endpoint & Mobile Device Management
- Vulnerability management

-
Network & Services Security
- Wi-Fi Security
- CWPP | Cloud Workforce Protection Platform
- Firewall & UTM
- SSL/TLS inspection
- IPS/IDS | Intrusion Prevention & Detection Systems
- MFA | Multi-Factor Authentication
- NDR | Network Detection and Response
- DDoS Protection
- Offensive security
- SASE | Secure Access Service Edge
- SWG | Secure Web Gateway
- WAF | Web Application Firewall
-
E-Mail & Communication
-
Network & Application Monitoring
-
Data Security
-
Endpoint Security
-
Automation & Management
-
For Partner
- Events
-
Services
- News
- Contacts

Flowmon Collector
Vendor:
Progress Software
IT solutions:
NPM | Network Performance Monitoring
Category:
Network & Application Monitoring
The NetFlow Collector is a stand-alone appliance for the collection, long-term storage and analysis of flow data from flow-enabled devices (load balancers, switches, and routers), dedicated probes and other flow sources. It is equipped for advanced reporting and data visualization.
SOLUTION OVERVIEW
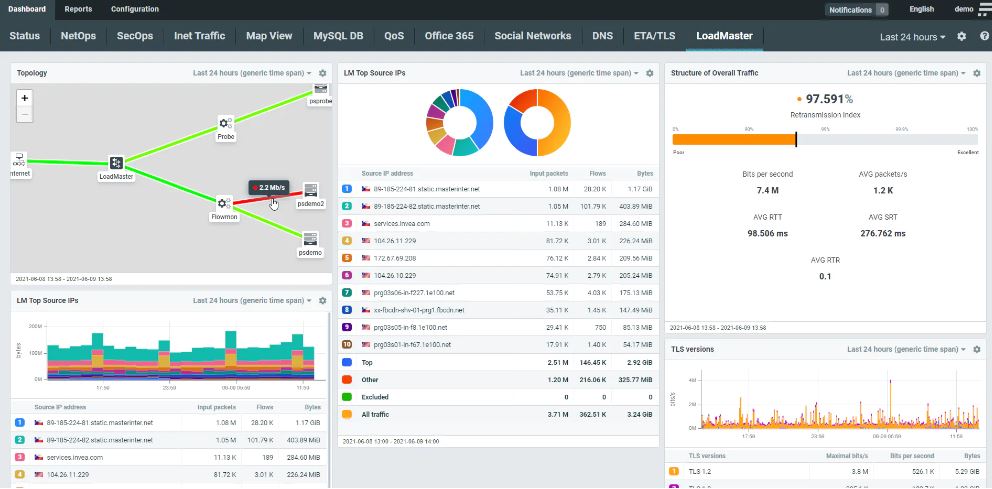
Dashboards and visualization
Highly customizable interface designed for the noise-free visualization of traffic structure, performance metrics and infrastructure topology with flexible and configurable widgets. Use presets built around the most common needs of users (Office 365, G Suite, social networks, DNS, DHCP…) to automate configuration. Whether you are a user or service provider, you can share your dashboard with others.
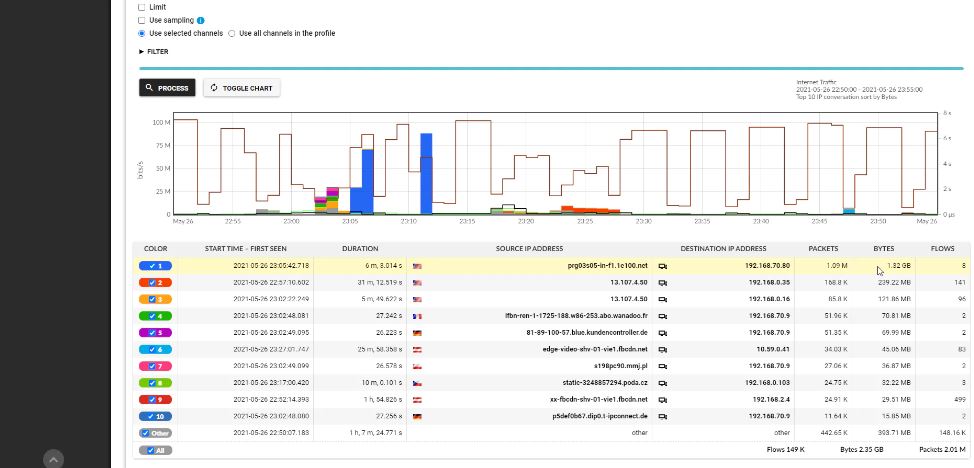
Analytics drilldown
Drilldown options are available from anywhere on the dashboard. Every widget can be displayed in an analytical view for full detail, down to the level of flows or packets with the ability to view the smallest network activity of devices, flow sources or vendors. You have options to filter by protocols, time periods, source/destination IP address, and more. The statistics are exportable at every level.
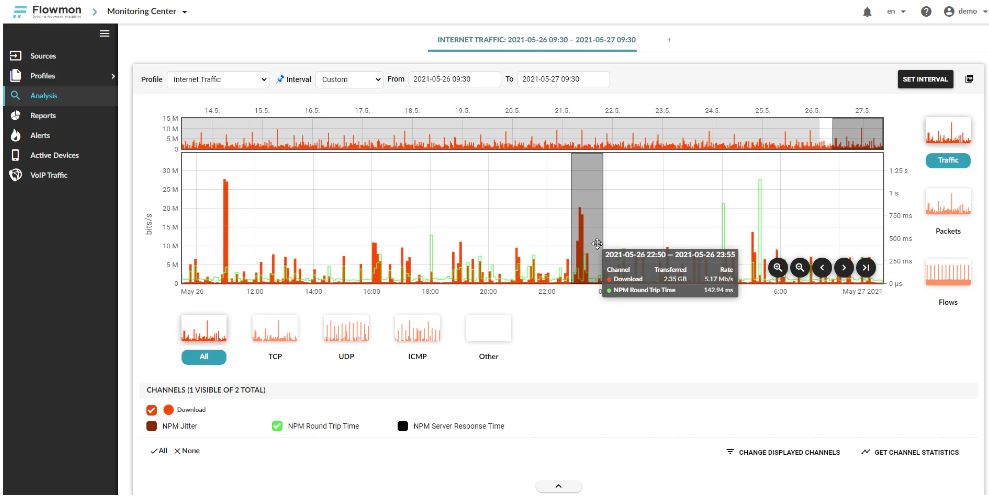
Troubleshooting and forensics
The Collector does more than just monitor the red/green status. It tracks individual user interactions with applications to give you an end-to-end understanding of the entire digital environment. This holistic approach allows you to immediately identify the root-cause of problems affecting users and services and take remedial action.
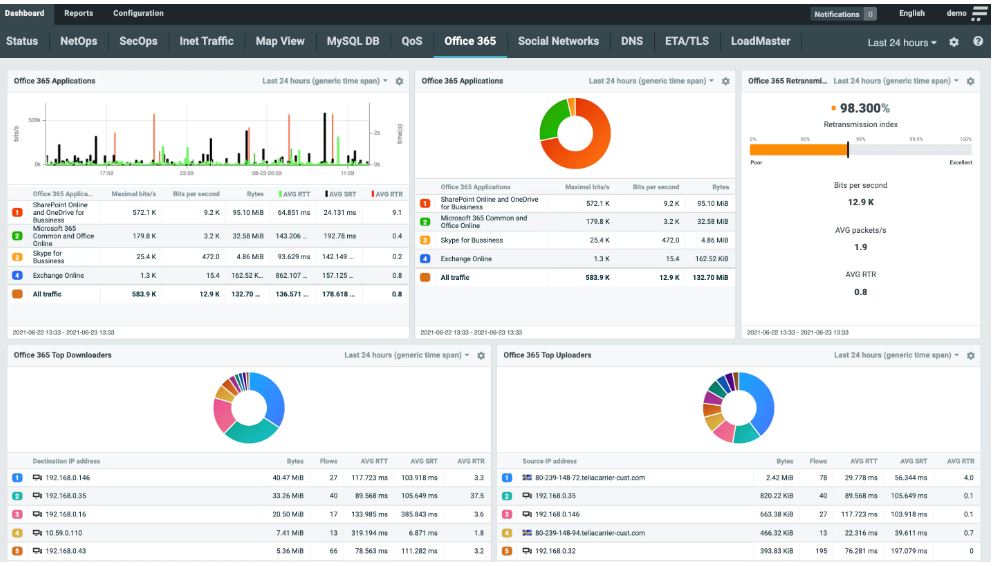
Cloud and SaaS monitoring
Flowmon uses passive network sensors available as virtual appliances in the private and public cloud, accessible from their respective marketplace to inspect all traffic for application-related communications. The Collector tracks the interactions between users and applications to identify bottlenecks anywhere along the application delivery chain.
FEATURES:
A Holistic Approach to Network Monitoring
Though red/green server status may be sufficient for availability monitoring, Flowmon’s market-leading NPMD solution will give clear insight for user experience monitoring, troubleshooting and capacity planning.
Compatibility
Flowmon Collector can process data in all standard formats such as NetFlow, IPFIX, sFlow, jFlow or NetStream. It supports data exported from any device, allowing for smooth integration into any network.
Hybrid Environment-Ready
Native cloud traffic mirroring combined with the ability to process and normalize heterogeneous data from multiple sources, the Collector provides a uniform level of transparency throughout the public cloud, on-premise or hybrid environments.
Versatility
Flowmon Collector can serve as a tool for network data analysis, allowing the user to see the “big picture”. It can also be used as a proxy to forward the data to security or analytical platforms, or it can serve as a comprehensive and reliable data storage. The Collector simply adapts to the user’s needs.
Scalability
Small businesses or global networks with distributed architecture - Flowmon Collector can serve as a central point of network data storage and analysis with unlimited scalability. Add more Collectors or Flowmon Probes for larger networks and get complete, cost-effective coverage.
Performance
The Collector has the highest performance in flows/s per appliance on the market. Its database system is built for fast data processing and it has enough space to store the resulting amounts of data.
Predefined Views and Reports
Flowmon comes with configuration templates for out-of-the-box functionality. In only a few clicks, the system automatically creates dashboards and reports for the user.
Hard Evidence
The solution creates a shared information space for all IT departments, so that they may collaborate, pool expertise together and make informed decisions without delay.
Transparent Network
Hybrid and cloud traffic is monitored and visualized in near-real time, and presented in a single consolidated view as easy-to-read charts and graphs
Optimization
Drilldown data is always available at hand, facilitating rapid analysis and identification of issues and bottlenecks. The data is neither sampled nor aggregated for the level of detail needed.
Reduced MTTR
Network administrators can perform troubleshooting and ticket resolution with far greater speed. Resolve up to 95% operational network issues from the same dashboard.
Customization
Data can be exported using the user’s choice of tool. Widgets can be configured to show precisely what needs to be seen. No clutter, just clear data.
IT solutions

Test a product
On local martkets Bakotech Group operates through a well-established partner network, including over 1,000 active dealers. Key IT-integrators and are involved in the realization of large-scale projects concerning implementing solutions for end-customers from various segments of business. Bakotech's business strategy is True Value Added Distribution or in other words - project oriented distribution.
We are providing our partners with a wide range of services such as PR, co-marketing activities, pre post-sales support, trainings for partners and end-customers, PoC, PoV, solution consulting, implementation support and technical support.
Contact Us
Bakotech Sp. z o.o.
Dane firmy
VAT ID 6762466740
REGON 122894922
KRS 0000467615
Kontakt
ph. +48 12 340 90 30
Related companies
Privacy policy
Subscribe to stay updated
Would you like to stay updated on the current IT and InfoSec news? About BAKOTECH events like webinars, trainings and conferences? Please, leave your e-mail:


© Bakotech - 2022. All rights reserved
